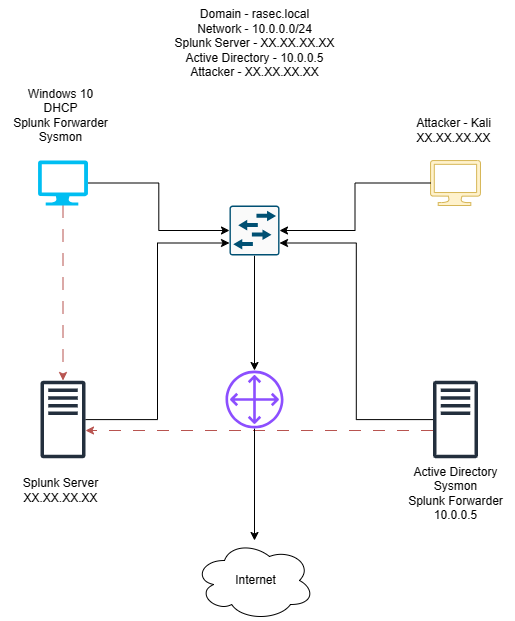
With our Active Directory set up for the most part, in this part, I’ll focus mainly on the splunk server and it’s configuration. I’ll put the diagram of the lab here for reference.
To begin with the installation we start by getting our splunk trial. For that we’ll head over to their official website (here) and fill in the required info. If you already have an account with splunk, you should be good to go without filling in any info. You can get the Linux version under the linux section. I’ll be downloading the .deb version for ubuntu installation.
Installing splunk on Linux is very straightforward. Once downloaded we can use the dpkg utility to install splunk.
1
sudo dpkg -i splunk*
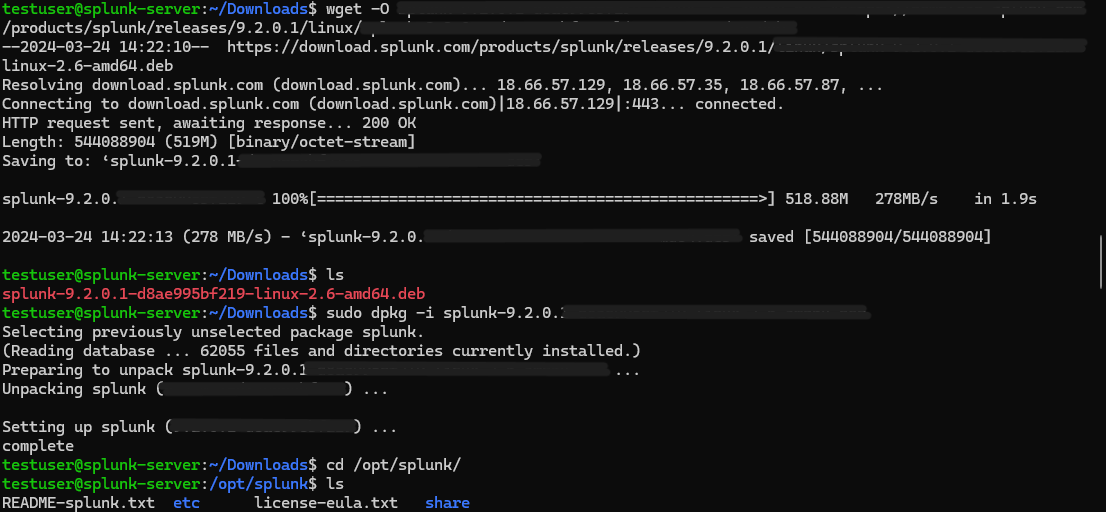
It’ll be installed under /opt directory.
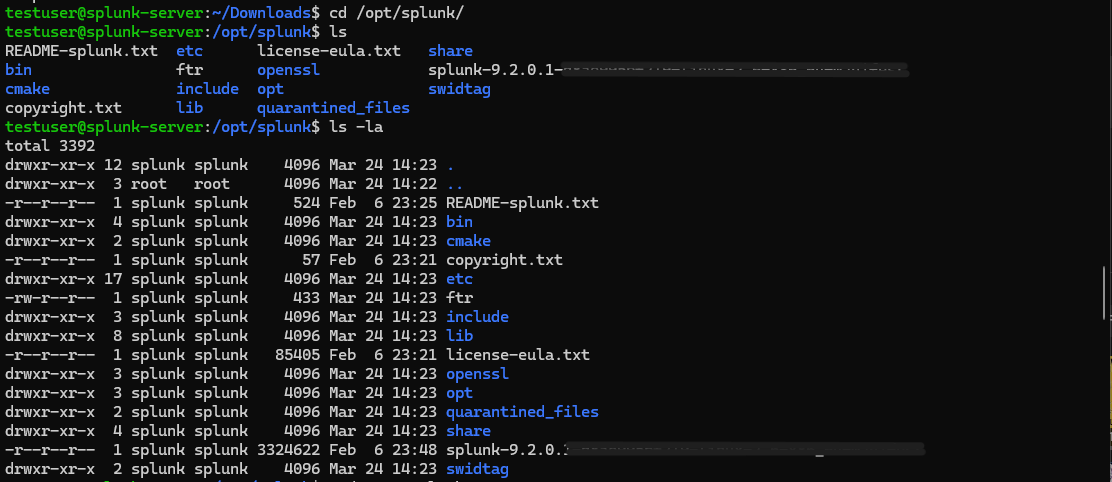
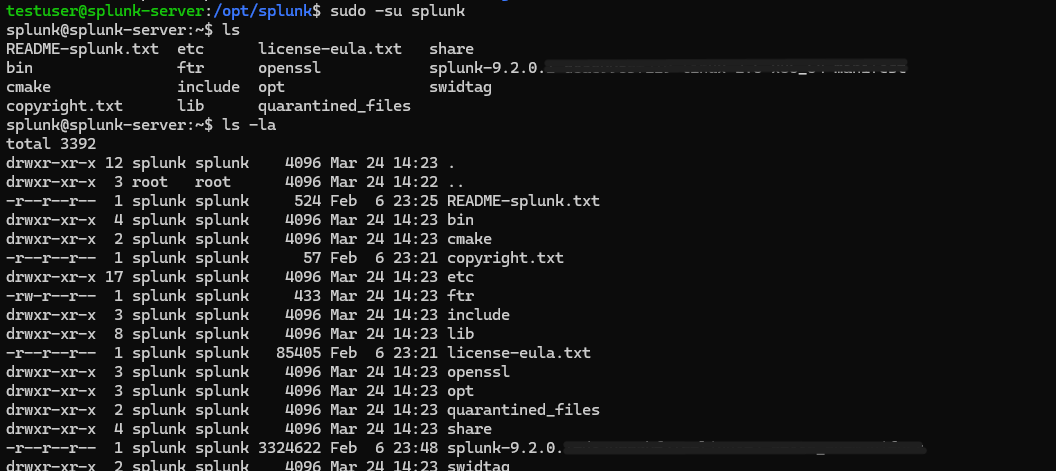
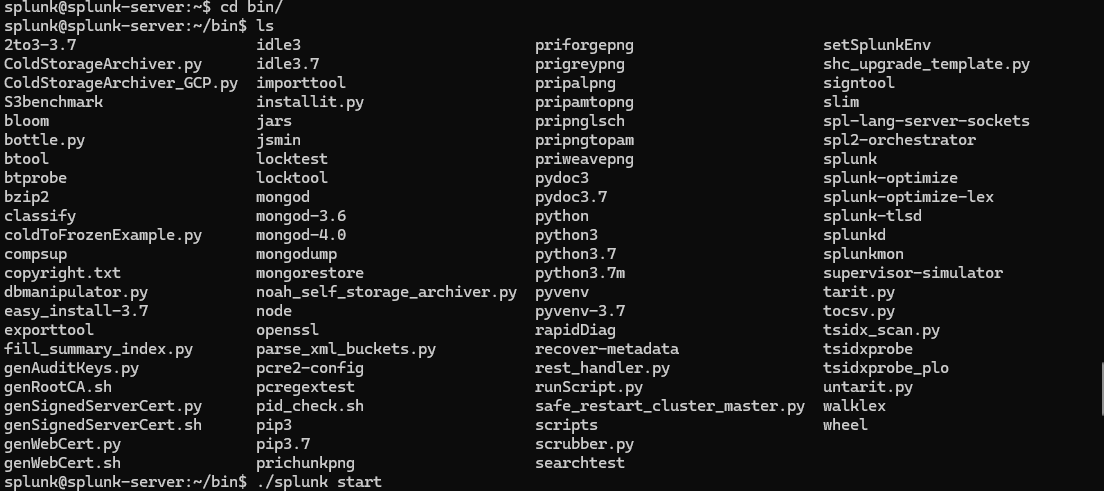
As you can see all the files are owned by the “splunk” user, so we’ll switch over to the splunk user and head to the /bin directory where all binaries related to splunk are stored. Once there, I’ll use the splunk binary to start the server.
1
2
3
sudo -su splunk
cd bin/
./splunks start
Once that is done, it will ask you to input the username and password of choice. Make sure to remember these well, as these will be the admin credentials to log into the splunk web interface.
Before we leave our commandline let’s make sure that splunk will start everytime the machine is rebooted.
1
sudo ./splunk enable boot-start -user splunk
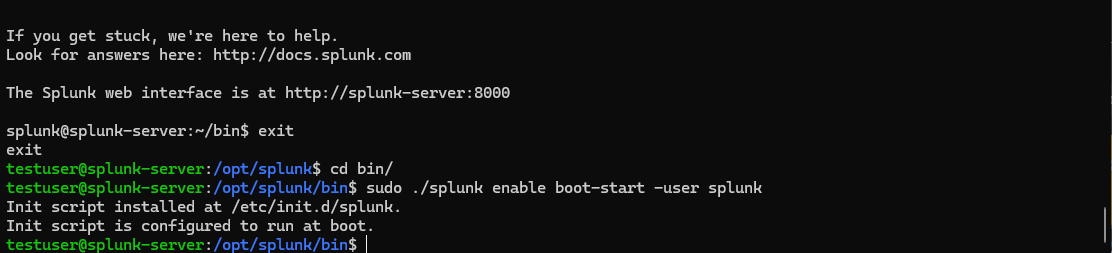
With this, the splunk web interface is live on port 8000 and we can head over to our Windows server to install splunk forwarder.
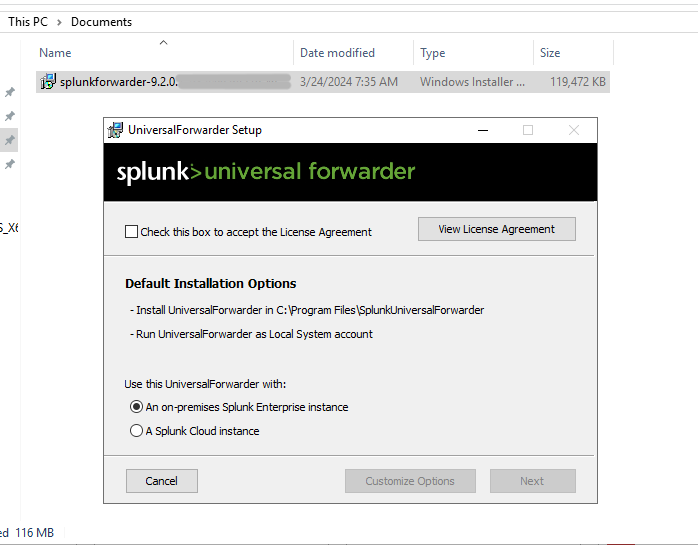
You can download the Splunk Universal Forwarder here.
Launching the installer, first we’ll select the on-prem Splunk instance and check the license agreement. And select the customise options button.
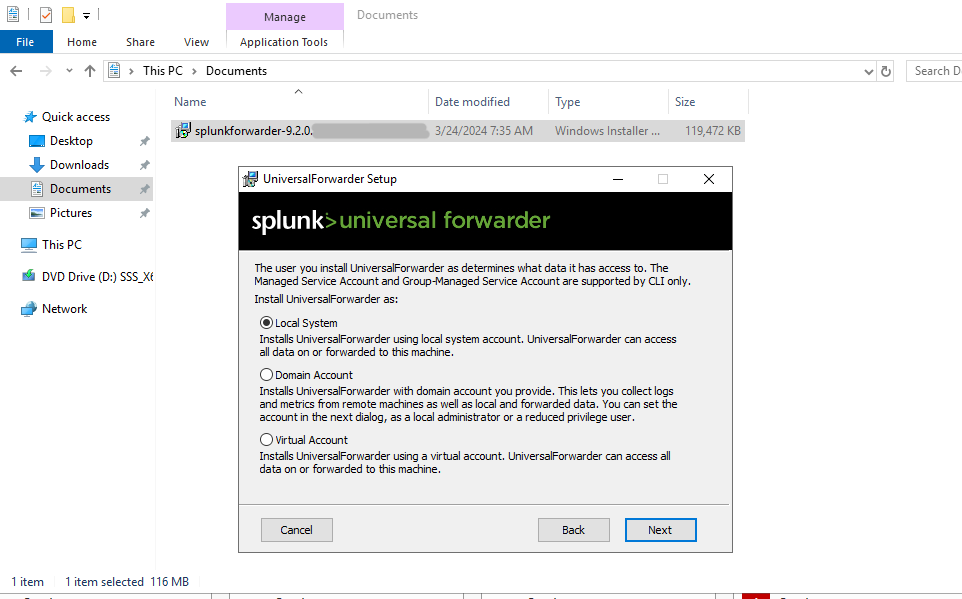
Next, we’ll select the Local System option.
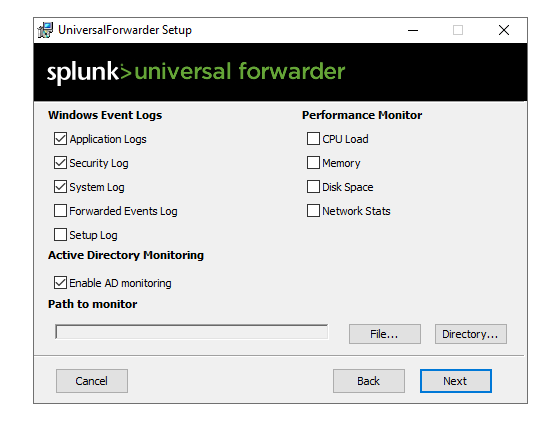
We’ll select the log sources which we want. I have selected a few as shown below.
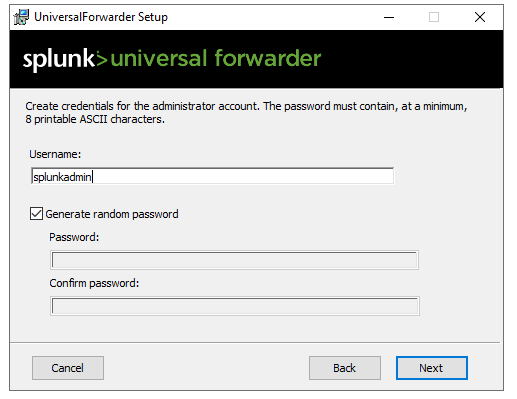
When it asks for credentials, you can put in any username.
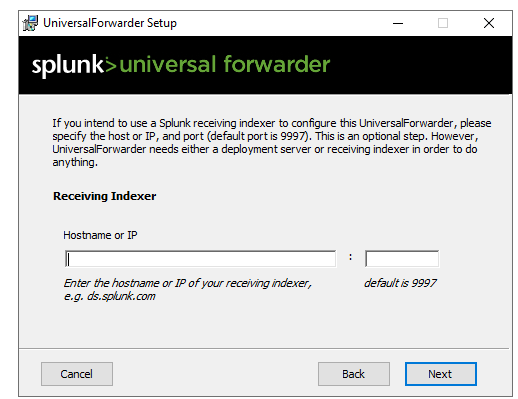
Click next until it asks for Receiving Indexer. Here we’re supposed to provide our splunk server IP and port. For port, I’m using the default port only i.e. 9997.
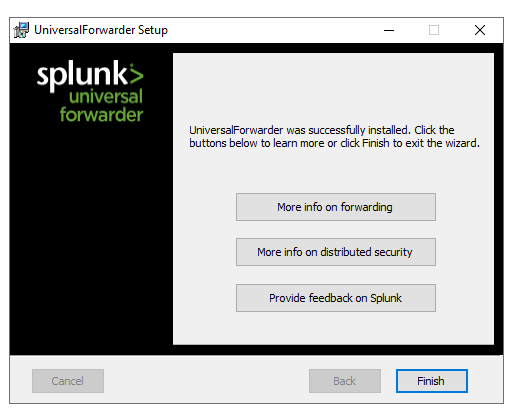
With this our forwarder should be installed properly.
Next we need to make some configurational changes. All the general configurations for the forwarder are stored in a specific “default” directory. (You can see the path below)
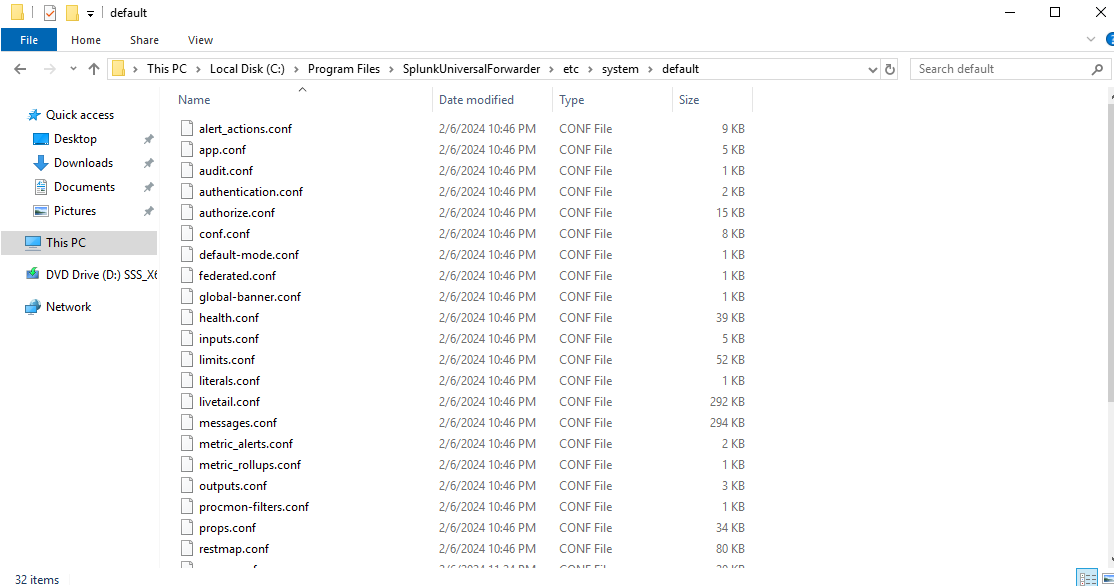
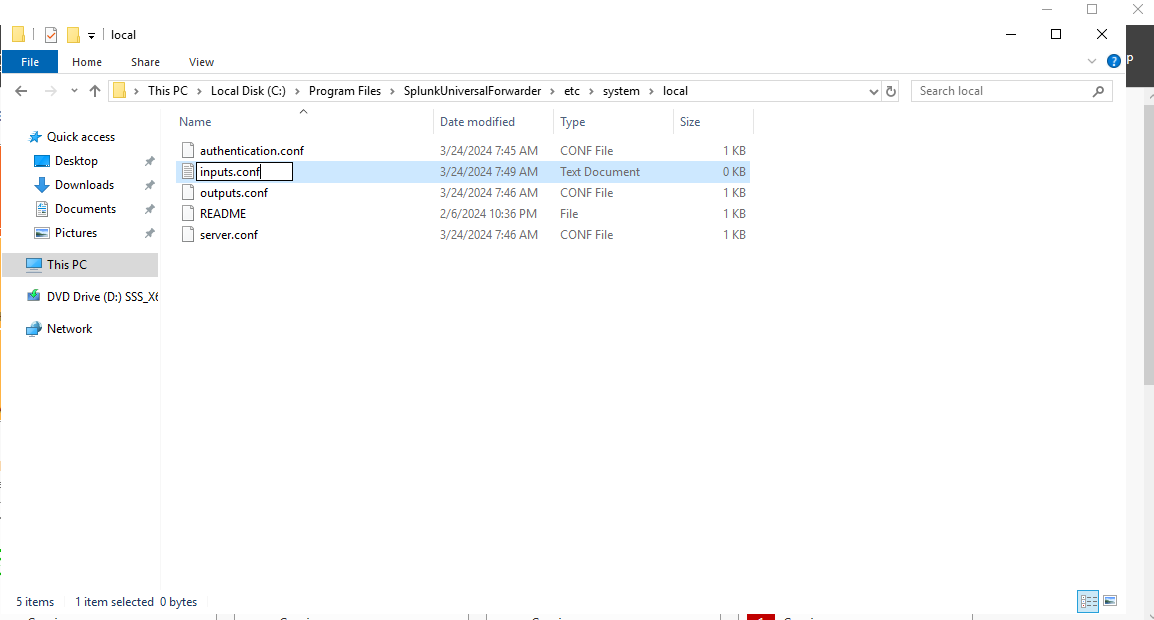
Here we need to make addition to the inputs.conf file to make sure that it forwards sysmon logs as well. But we’ll NOT make any changes in default directory as it is the failsafe directory. Instead we’ll head over to the local directory and create a new inputs.conf file. (You can see the path below).
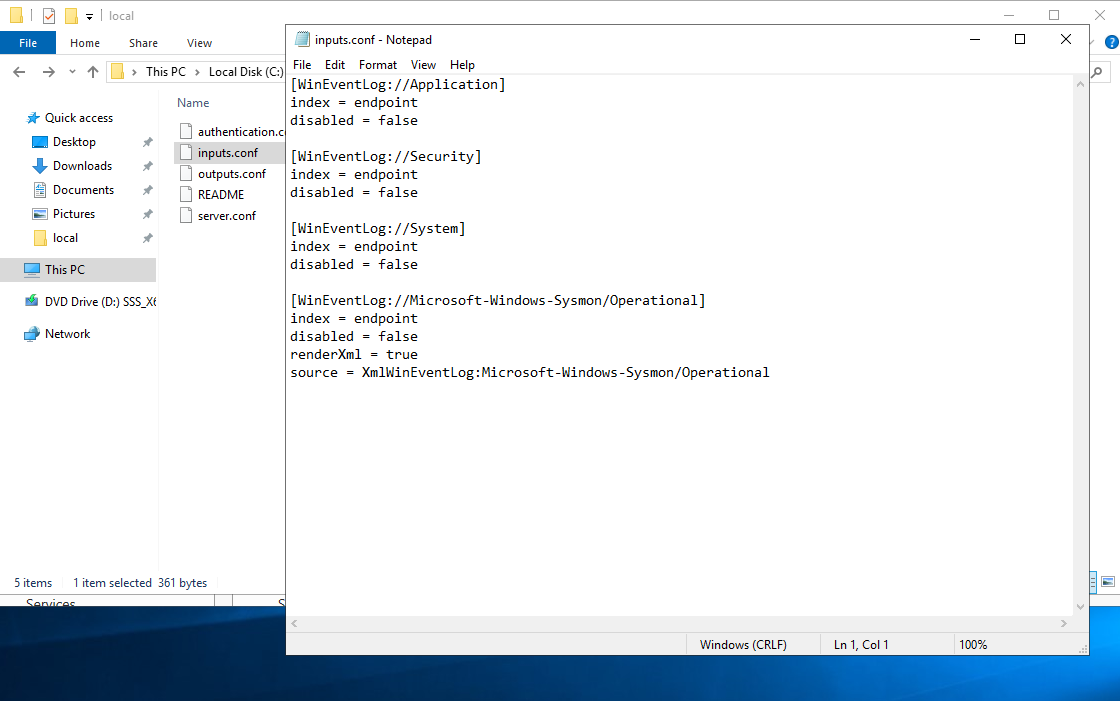
We’ll be using the following input configuration.
1
2
3
4
5
6
7
8
9
10
11
12
13
14
15
16
17
[WinEventLog://Application]
index = endpoint
disabled = false

[WinEventLog://Security]
index = endpoint
disabled = false

[WinEventLog://System]
index = endpoint
disabled = false

[WinEventLog://Microsoft-Windows-Sysmon/Operational]
index = endpoint
disabled = false
renderXml = true
source = XmlWinEventLog:Microsoft-Windows-Sysmon/Operational
Here you can also notice that all the logs will be forwarded to the “endpoint” index.
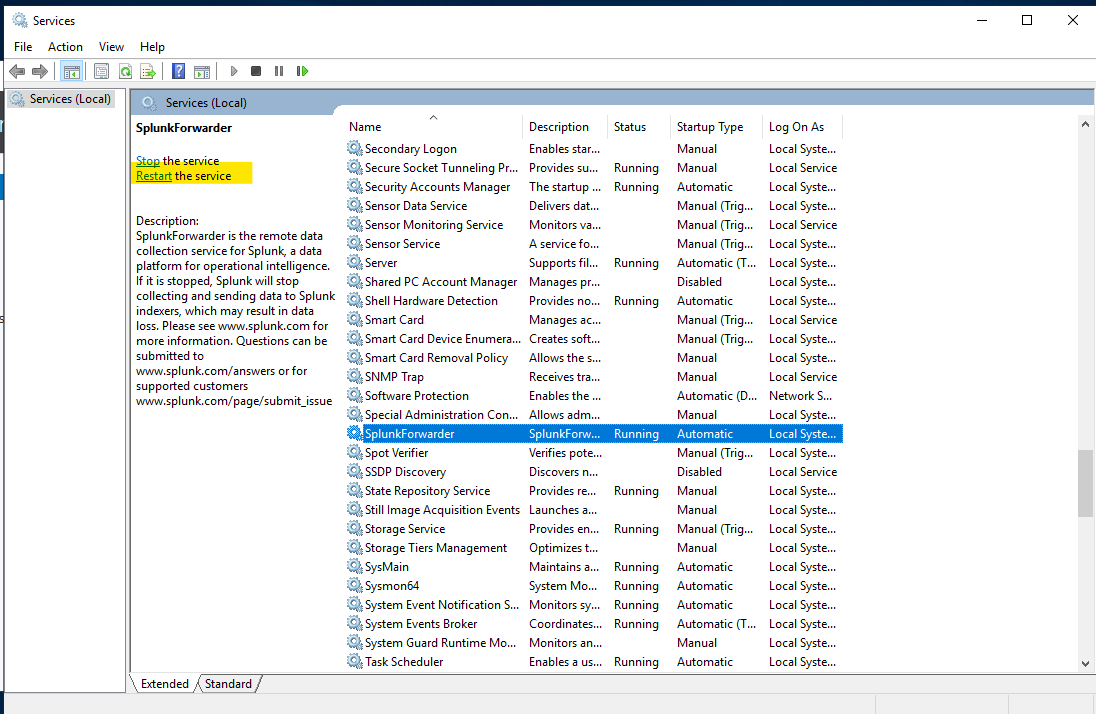
Next, since we updated the config file, we’ll have to restart the forwarder service. For that, we’ll head over to the services app.
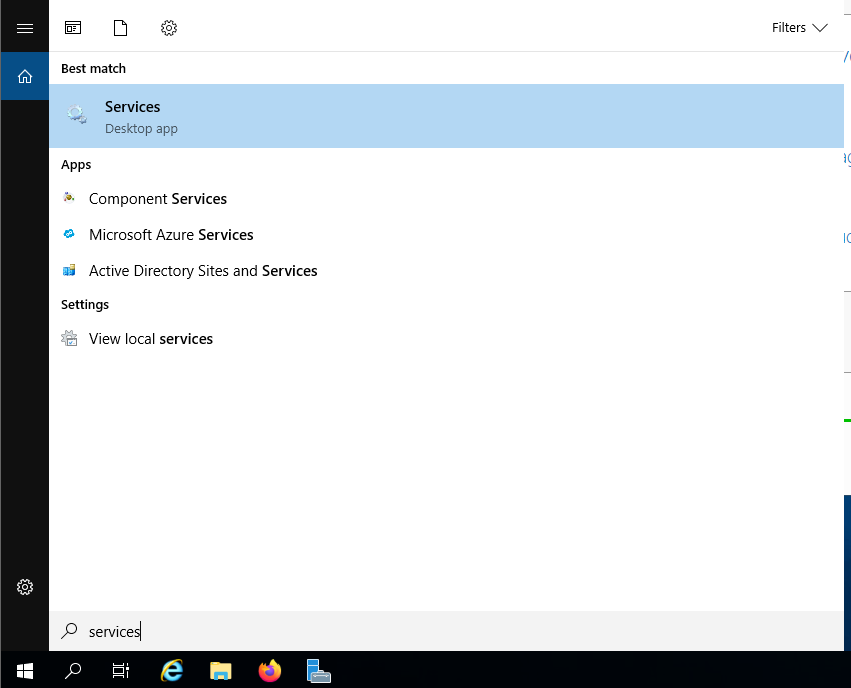
We’ll find the splunk forwarder and click on the restart button.
Now the Forwarder installation is completed. A little bit of configuration on the splunk web interface and we’re good to go!
PS - I have skipped over the forwarder installation on the windows 10 machine because the steps are exactly the same. The only thing that’ll change is that we’ll need to put in administrator credentials when asked.
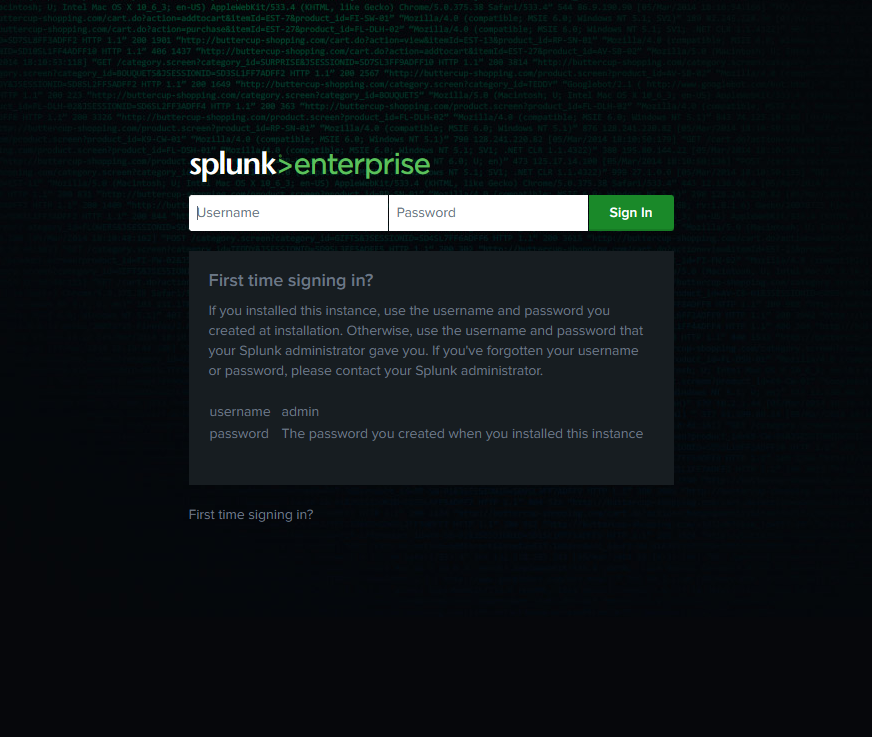
When visiting the port 8000 of our splunk server. We should be greeted with the splunk login page. Here you are supposed to use the credential which you setup during the splunk installation.
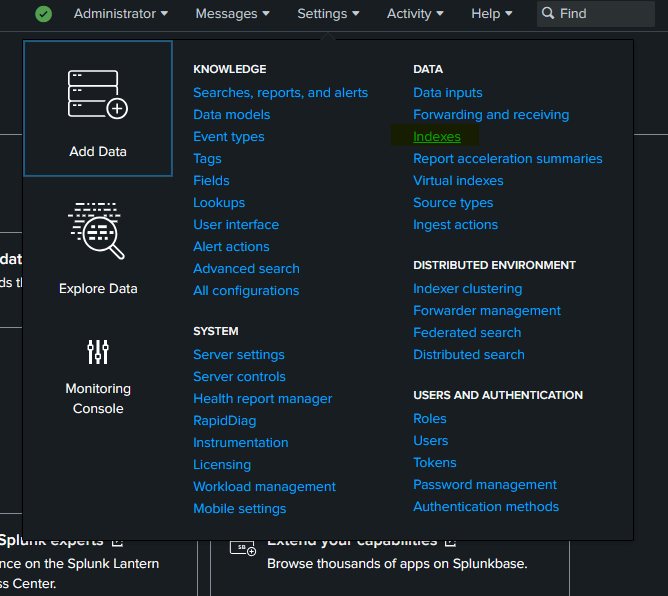
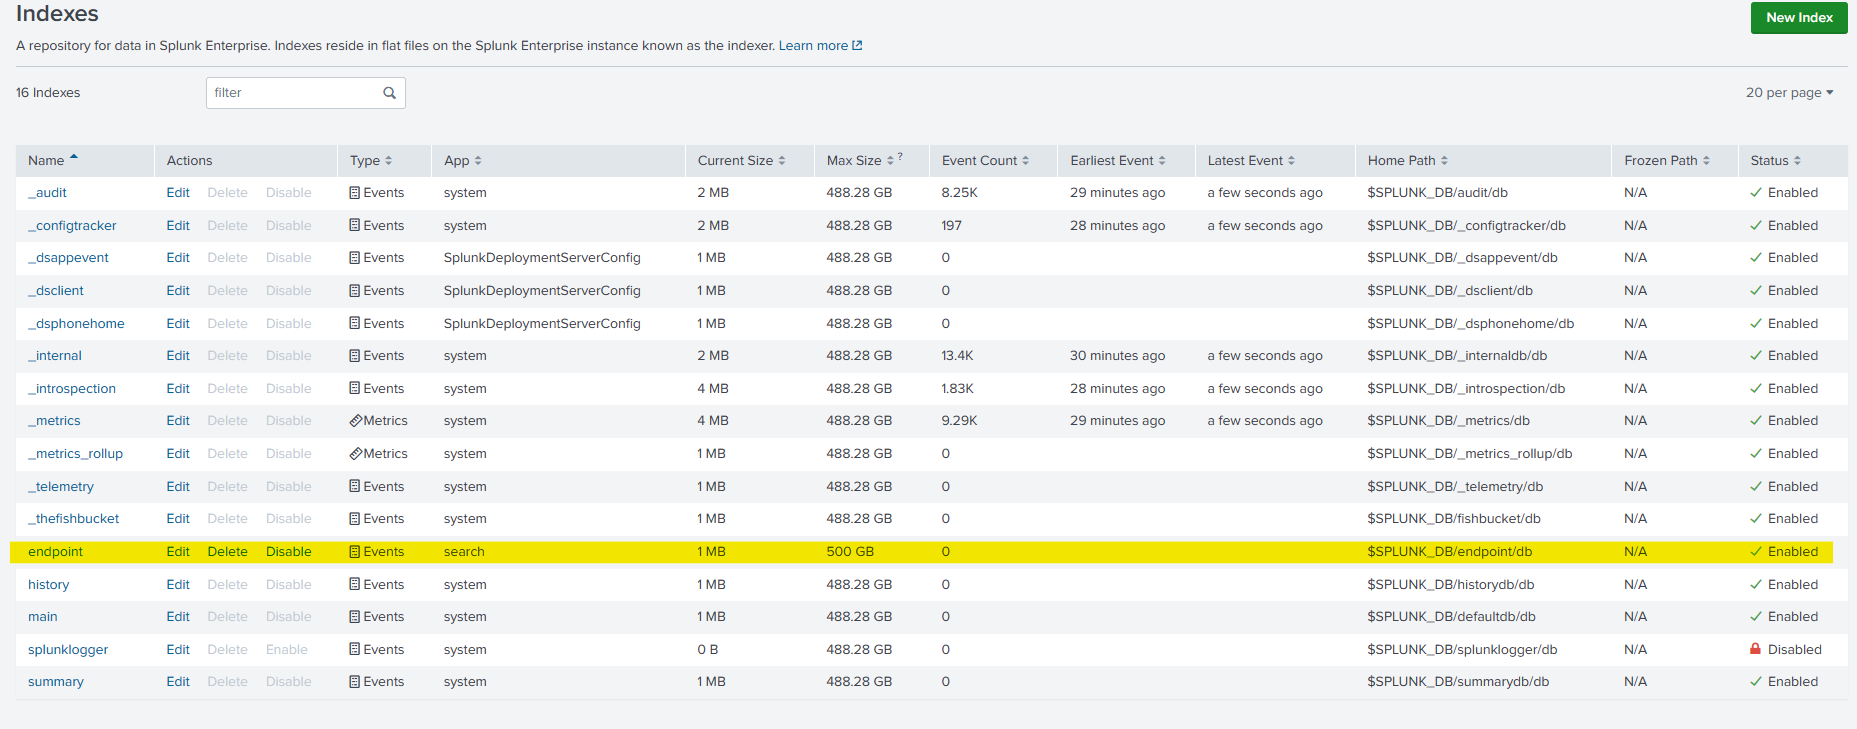
If you recall, all our logs are forwarded to the “endpoint” index. But is not a default index in splunk, so we’ll be creating a new index. For that we’ll head over to settings > indexes > New Index. And put in the name as “endpoint”.
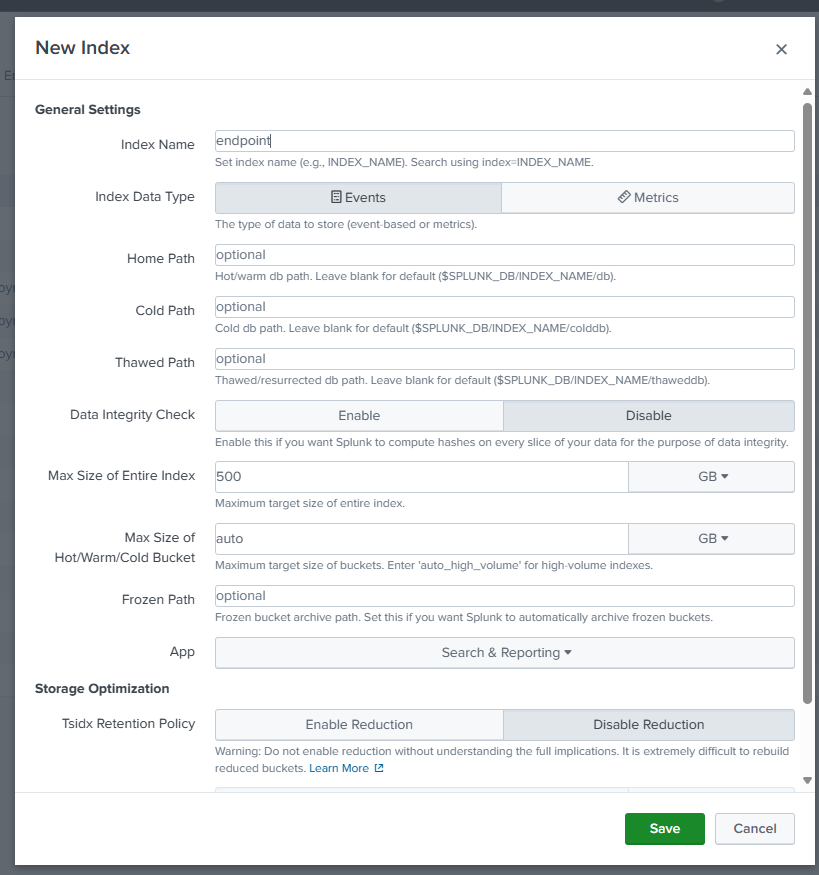
Once it is done we should be able to see our new index.
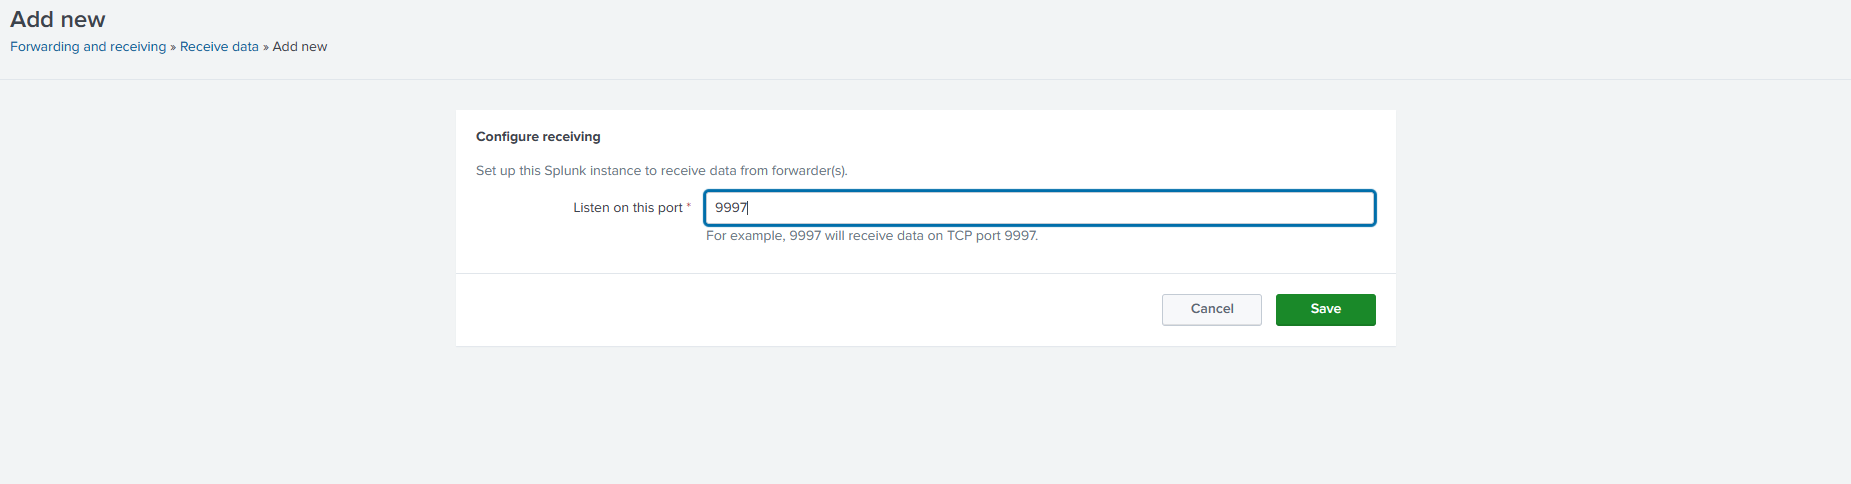
Next, we’ve to configure our splunk instance to receive logs at the specified port. If you remember, we used the default port i.e. 9997 in the forwarder. So here we have to configure the same in the splunk server as well.
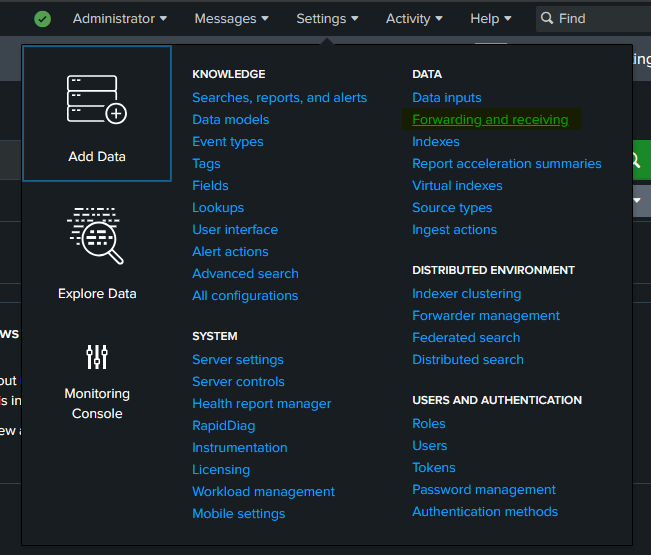
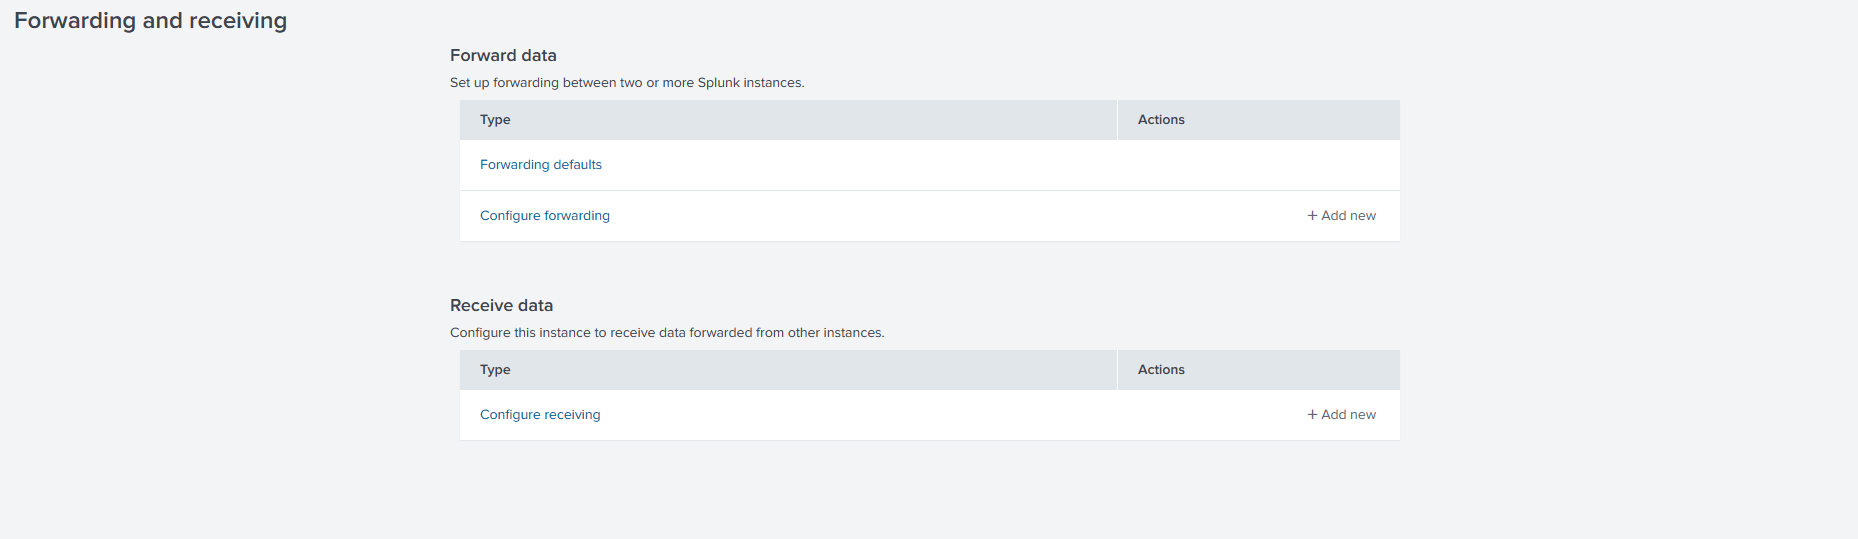
For that, we’ll head over to Forwarding and Receiving section under settings.
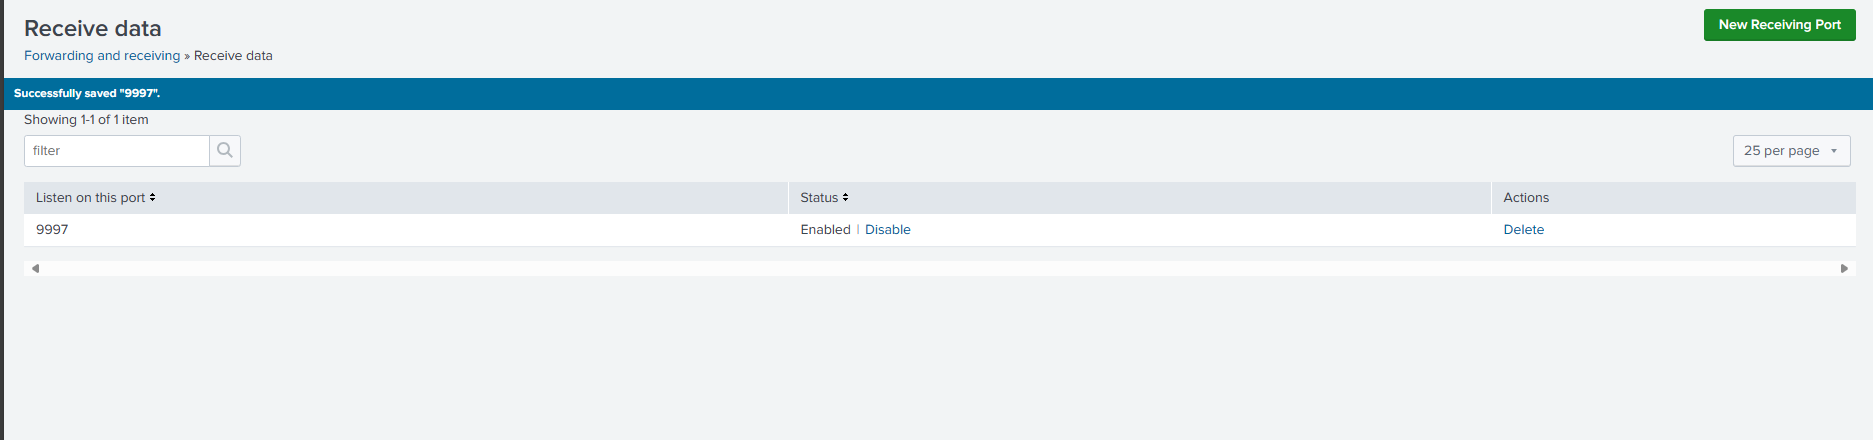
Here. we’ll click on configure receiving and instruct it to listen on port 9997.
We should be able to see one entry in the receiving section now.
Now all that’s left to do is, query our newly created index.
For that, we’ll head over to the seach and indexing section on splunk. I’ll run a basic query for our “endpoint” index.
1
index="endpoint"
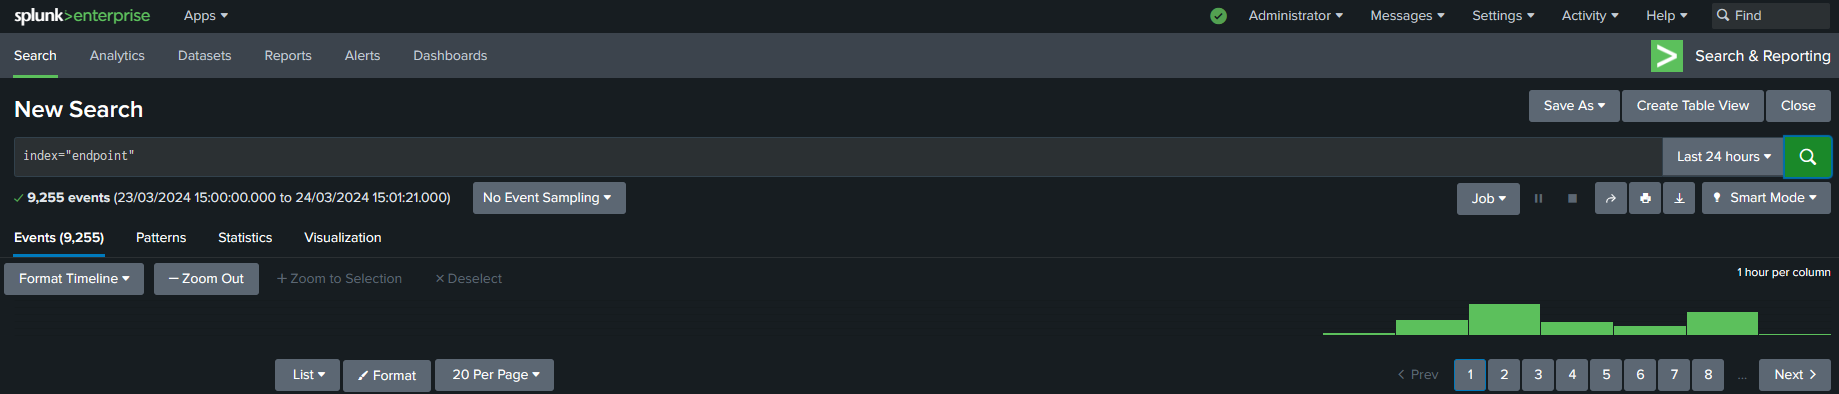
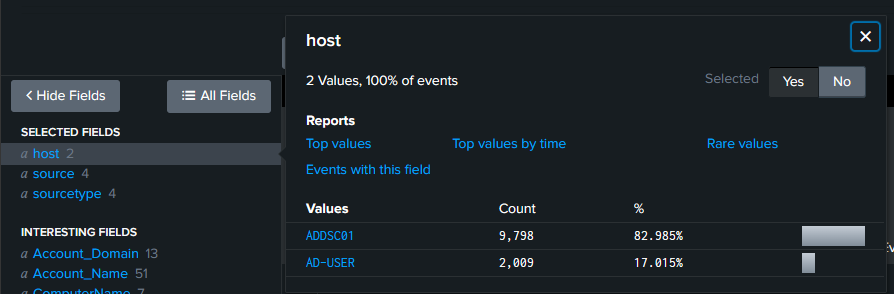
We can see the logs here. And to confirm that both our machines are sending logs, we can check the hosts section.
And we’ve successfully setup the lab! There is a lot more to come with lab. A lot more breaking and a lot more making. I recommend that at this point you create a snapshot of all the VMs in the virtualisation tool so that you’ll have a failsafe if somethings goes wrong with VMs. Until next time!
“My performance begins”